
- A low carb helps reduce blood sugars and insulin levels and helps improve common metabolic diseases (e.g. diabetes, heart disease, stroke, cancer, Parkinson’s and Alzheimer’s).
- We become insulin resistant when our adipose tissue becomes full and can’t store any more energy. Excess energy is then stored in the liver, pancreas, heart, brain and other organs that are more insulin sensitive.
- Endogenous ketosis occurs when we don’t eat, and we burn our own body fat (e.g. fasting). While insulin and blood sugar levels are low, we may have lower blood ketones flowing from our fat stores.
- Exogenous ketosis occurs when we eat lots of and/or take exogenous ketones. Our blood ketones may be higher, but our insulin levels will also rise because we have an excess of energy coming from our diet.
- Most of the good things associated with ketosis occur due to endogenous ketosis.
- Most people following a ketogenic diet have lower blood ketone values than Phinney’s ‘optimal ketosis’ chart, especially once they become fat adapted and are not trying to drive high blood ketones through the consumption of excess energy from refined fat.
- If your goal is blood sugar control, longevity or weight loss then endogenous ketosis with lower blood sugars and lower ketones is likely a better place to be than chasing higher blood ketones via lots of added dietary fat.
I have seen a lot of interest and confusion recently from people following a ketogenic about ideal ketone and blood sugar levels.
This article reviews blood ketone (BHB), breath ketone (acetone) and blood sugar data from a large number of people who are following a low carb or ketogenic diet to understand what “normal” and “optimal” really look like.
This understanding, based on real-life data from people following a ketogenic dietary approach, will help us fine tune our diet and lifestyle to suit our goals whether they be:
Many people initiate a low carb diet to manage their blood glucose levels, insulin resistance or diabetes.
As shown in the chart below, foods with less carbohydrate do in fact have a smaller impact on our blood sugar.[1] [2] [3]

While not typically recommended by dieticians and diabetes associations, it it appears that, if you are insulin resistant, have prediabetes, or full-blown diabetes (Type 1 or Type 2) it makes sense to reduce the carbohydrates in your diet to the point where you can achieve the blood glucose levels of a metabolically healthy person.
According to mainstream medical definitions:
- “normal” blood sugar regulation is defined as having a HbA1c of less than 6.0%,
- “Prediabetes” is diagnosed when you have an HbA1c between 6.0 and 6.4%, and
- Type 2 diabetes is diagnosed when you have an HbA1c of greater than 6.4%.
However, as you can see from the charts below, this definition of “normal” is far from optimal.

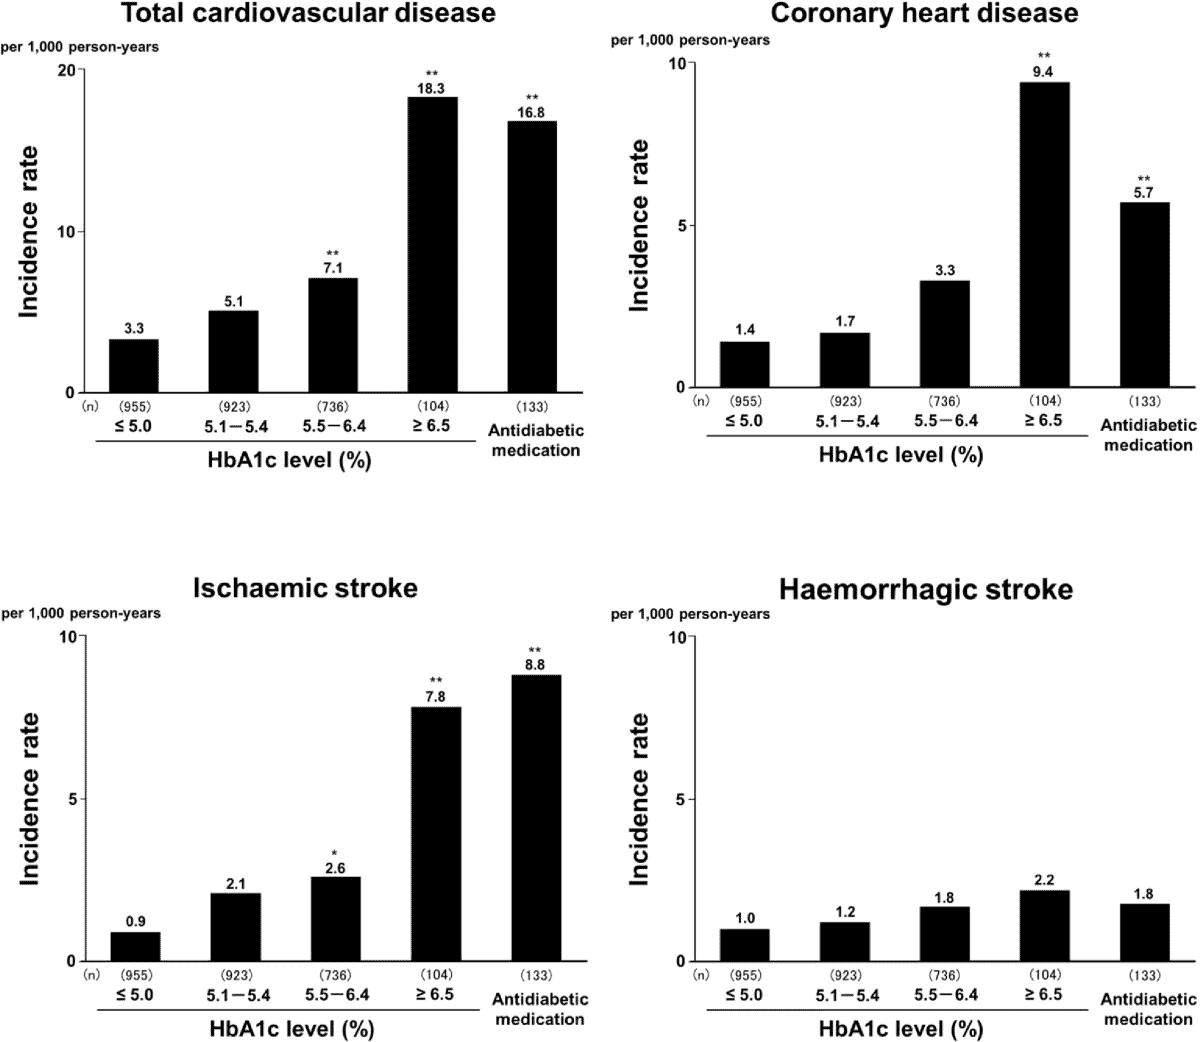

By the time you have “pre-diabetes” (with an HbA1c of greater than 6.0%), you are at risk of many of the most common western diseases of ageing and causes of death (i.e. heart disease, stroke, Parkinson’s, Alzheimer’s and cancer).[4] [5]

If you’re interested in optimal rather than that what currently passes for “normal” health, the table below shows some suggested HbA1c and average blood sugar targets for optimal health and longevity.
| risk level |
HbA1c |
average blood sugar |
|
|
(%) |
(mmol/L) |
(mg/dL) |
|
| optimal |
4.5 |
4.6 |
83 |
| excellent |
< 5.0 |
< 5.4 |
< 97 |
| good |
< 5.4 |
< 6.0 |
< 108 |
| danger |
> 6.5 |
> 7.8 |
> 140 |
While high glucose levels are bad news in and of themselves (glucose toxicity and excessive glycation), high blood sugars typically go hand in hand with high insulin levels which are also bad news.[6] [7] [8]
A metabolically healthy person will store excess energy in their fat cells, ready for easy access when required later. But if we continue to fill our fat cells with the excess energy they get to the point where they cannot continue to expand to accept more energy. It is at this point that our adipose tissue becomes insulin resistant. Ted Naiman does an excellent job explaining this.
The good news is that insulin resistance will slow the expansion of our fat cells (the excess energy can’t get in as easily). The bad news, however, is that once our fat cells become insulin resistant the excess energy will be re-directed to the parts of our body that are more insulin sensitive such as our liver, pancreas, heart, brain and other vital organs.
Our pancreas will work overtime secreting more insulin to try to keep the energy in the liver as well as put it back into storage.
High insulin levels mean that we will find it harder to release energy from our fat stores when we go without food.[9] Without easy access to our body fat stores, we will be driven by our appetite to eat again sooner.
Someone who is insulin resistant is more likely to become obese because their chronically elevated insulin levels will drive them to eat more often because, without easy access to their fat stores, they feel bad without a constant flow of glucose for energy.

Fasting insulin levels in healthy populations range between 2 to 6 mIU/L.[10] [11] [12] The average insulin levels in western populations are 8.6 mIU/L. Meanwhile, the official reference range for “normal” fasting insulin is less than 25 mIU/L.[13] [14] Given that the western world is going through a crisis of metabolic health, it is safe to say that, similar to the “normal” blood glucose levels, this cut off for ‘normal’ insulin levels is also far from optimal.

To help optimise your insulin levels and blood sugar you can tailor the insulin load of your diet to suit your current level of insulin resistance. As shown in the chart below, our insulin response to the food we eat is proportional the net carbs in our diet plus about half the protein it contains.

Reducing the insulin load of your diet can help to reduce your insulin and blood sugar levels to the point where your pancreas (and any insulin resistance you may have) can keep up.
When our insulin levels are low, we can access our body fat for fuel, either from our body or our food. We then see the ketone levels in our blood rise. At this point, we are deemed to be “in ketosis”.
A person with type 1 diabetes (like my wife Monica) is not able to produce enough insulin from their own pancreas. Without exogenous insulin injections, they will see both their blood glucose and blood ketones rise to very high levels. This is called ketoacidosis which is a dangerous and requires exogenous insulin as soon as possible to prevent their body from falling apart.
Without insulin, people with type 1 diabetes are unable to metabolise glucose and turn to their muscles for energy. As shown in the image below of JL, one of the first children with type 1 diabetes to receive insulin, they quickly regain weight.

Rather than minimising insulin, it’s important to find the optimal balance of insulin. We want to have the blood sugars and insulin levels of a metabolically healthy period. Lowish blood ketones with healthy blood glucose levels is a normal healthy state where your body fat can more easily be accessed for fuel.
People who switch to a low carb diet often find that their blood glucose and insulin levels plummet and they are not hungry because energy can more easily flow out of storage (a little bit like someone with uncontrolled type 1 diabetes).
However, the problem with a very low insulin load dietary approach (e.g. very high fat therapeutic ketogenic diet), is that it may not contain enough of the vitamins and minerals that you need for optimal function and avoid nutrient cravings in the long term.

High-fat foods also have a high energy density which can make it hard for some people to control portion sizes. This can be problematic if their goal is weight loss. Very high-fat foods also tend to be less nutrient dense.

When we go without food, our blood glucose levels will decrease as the glucose in our bloodstream and liver (glycogen) are used up. The body then turns to our fat stores and our liver converts them into ketones for use. This is termed “endogenous ketosis” (endogenous = originating from within an organism).
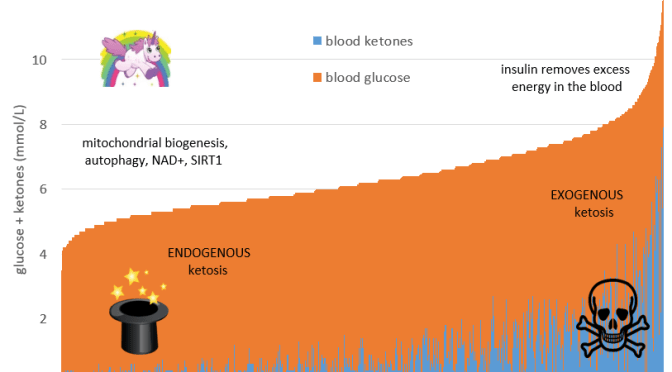
As explained by Dr David Sinclair in this video, there are a tonne of beneficial things that occur during endogenous ketosis such as autophagy, mitogenesis, mitophagy, upregulation of SIRT1 and increase of NAD+).
The chart below shows my blood sugar and blood ketone (BHB) during a recent seven day fast. As glucose levels decrease, ketone levels rise.

You can see that the sum of glucose and ketones continues to increase during fasting. I have termed the sum of glucose and ketones as “total energy” (i.e. glucose + ketones).
Often in fasting, it seems that the body will let the total energy in the blood go quite high. This enables you to be in a state of very high alert ready to find food to survive. It feels great. I typically feel at my sharpest after not eating for a few days.
I think it’s important to understand the difference between exogenous ketosis and endogenous ketosis.
- Endogenous ketosis is when we eat less than the body needs to maintain energy balance and we are forced to use some of our body fat to make up the difference.
- Exogenous ketosis occurs when we eat lots of fat (or take exogenous ketones), and we see blood ketones (beta-hydroxybutyrate) build up in the blood.
Ketones in the blood occur when you are eating more fat than you are burning. Lower blood ketones are not a cause for concern as long as your blood glucose levels are also low (i.e. low total energy).
The reality is that we will all be somewhere on the spectrum between exogenous and endogenous ketosis. We need enough energy to get through the day and not fade away.
But keep in mind that most of the good things we attribute to ketosis and the ketogenic diet occurs due to endogenous ketosis when fat is coming from our body.
We may not have high blood ketone levels when we are in endogenous ketosis, but that’s OK because that’s where the good stuff.
The ketogenic diet is still evolving and fertile area of research. Even Keto Clarity co-author Eric Westman recently admitted that there is still a lack of clarity around what constitutes ideal ketone levels.[15]

The chart below shows the ‘optimal ketone zone’ from Volek and Phinney’s Art and Science of Low Carb Living which is typically referred to as the ultimate guide to optimal ketone values.

The problem, however, is that it’s hard for most people to achieve “optimal ketone levels” (i.e. 1.5 to 3.0mmol/L) without fasting for days or eating a lot of additional dietary fat (which may be counterproductive if you are trying to lose weight).
Recently, I had the privilege of having Steve Phinney (pictured below in our kitchen making his famous blue cheese dressing) stay at our place for a night when he spoke at a Low Carb Down Under event in Brisbane.

I quizzed Steve about the background to this optimal ketosis chart. He said it was based on the blood ketone levels of participants in two studies. One was with cyclists who had adapted to ketosis over a period of six weeks and another ketogenic weight loss study. In both cases these ‘optimal ketone levels’ (i.e. between 1.5 to 3.0mmol/L) were observed in people who had recently transitioned into a state of nutritional ketosis.
Since the publication of this chart in the Art and Science books, Phinney has noted that well-trained athletes who are long-term fat adapted (e.g. the athletes in the FASTER study) actually show lower levels of ketones than might be expected.
Over time, many people, particularly metabolically healthy athletes, move beyond the ‘keto adoption’ phase and are able to utilise fat as fuel even more efficiently and their ketone levels reduce further.
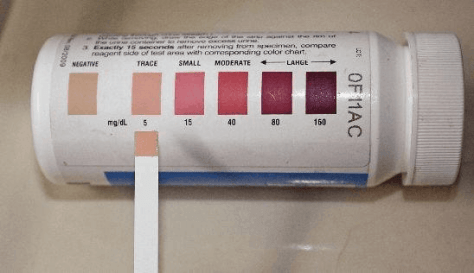
Urine ketone strips are often considered to be of limited usefulness because the body stops excreting ketones as it learns to use them. Could it be a similar situation with blood ketones (BHB), albeit over a longer period of time?

As our blood glucose levels decrease, our ketones increase to balance out the fuel deficit. When we have less glucose available our insulin levels go down, more fat is burned, and blood ketone levels rise.
The chart below shows the sum of the blood glucose and ketones (i.e. total energy) from nearly three thousand data points from a broad range of people following a low carb or ketogenic dietary approach.

[In late 2015 I pooled a range of data from myself and a number of people on the Optimal Ketogenic Living (OKL) Facebook group. After sharing this data initially, a number of other people sent me their data. Later, Michel Lundell from Ketonix agreed to share an extensive set of anonymised data for me to analyse.]
On the left-hand side of the chart, we have a low energy situation where insulin levels are also low. The body will be drawing on stored body fat for fuel to meet the shortfall and weight loss will occur.
On the right-hand end of the chart, we have a high energy situation from both glucose and ketones. This high energy situation causes the pancreas to secrete insulin to hold the glycogen back in the liver and stop lipolysis (i.e. the release of fat from storage) because there is more than enough energy floating around in the blood.
It’s a slight oversimplification to say that the left-hand side of the chart is endogenous ketosis (which is good) and the right is exogenous ketosis (which is bad).
We may or may not see high blood ketone levels when we go without food for an extended period. However, replicating high ketone levels with high levels of exogenous ketones or an oversupply of dietary fat is not the same as endogenous ketosis, even though both situations are called “ketosis”.
Based on this data it seems the body tries to maintain a blood glucose level of around 4.9mmol/L and a blood ketone level (BHB) of around 1.5mmol/L. The table below shows this data in terms of average as well as the 25th percentile and 75th percentile points (i.e. 50% of the values fit between the 25th and 75th percentiles).
|
ketones (mmol/L) |
BG (mmol/L) |
BG (mg/dL) |
HbA1c |
GKI |
BrAc |
total energy (mmol/L) |
|
| 25th |
0.6 |
4.2 |
76 |
4.3 |
1.8 |
46 |
3.4 |
| average |
1.5 |
4.9 |
89 |
4.7 |
7.3 |
56 |
6.4 |
| 75th |
2.1 |
5.6 |
101 |
5.1 |
14 |
66 |
12.9 |
Some people come to low carb or keto for therapeutic purposes (i.e. to manage chronic conditions such as cancer, epilepsy, traumatic brain injury or dementia). These people will benefit from high ketone levels to feed the brain when glucose cannot be processed due to high levels of insulin resistance.
Most people, however, do not require this degree of therapeutic ketosis, particularly if managing insulin resistance or obesity is the priority. People using low carb to manage diabetes or weight loss goals may end up driving excess energy consumption and a lower than necessary nutrient density, both of which may be counterproductive.

People following a therapeutic ketogenic diet may be fuelling up with MCT oils to achieve high ketone levels and low glucose:ketone index values (GKI) value for therapeutic purposes. Others will target high levels of ketones for brain performance. Others will load up on exogenous ketones and glucose to ‘dual fuel’ the system for athletic performance.
One of the benefits of a low carb or keto diet is that it tends to eliminate a lot of hyper-palatable processed foods, and lowers insulin levels which help many people normalise their appetite and eat less.
The danger, however, with trying to drive exogenous ketosis is that it will lead to an energy excess situation which will drive insulin to remove excess energy from your bloodstream, which can worsen insulin resistance.
Even though we are getting most of our energy from fat rather than carbs, the body will still work to bring the total energy back towards optimal levels using insulin, and stop the release of stored glycogen and body fat until you have used up the energy in your blood from your food. This is why Thomas Seyfried and Dominic D’Agostino talk about the benefits of a calorie restricted ketogenic diet. [16] [17] [18]

Many people embark on a ketogenic dietary approach to manage their diabetes and achieve long-term weight loss. They want lower insulin levels to enable them to burn more body fat for long-term insulin sensitivity and health.

On the left-hand side of the total energy chart below, we have a situation where we are generating endogenous ketosis, meaning that our own body fat is being burned for fuel. With a lower total energy level in our blood, our body needs to pull fat from our body fat stores as well as use excess stored fat and old proteins in our liver, pancreas, brain and other vital organs (i.e. autophagy).

To understand what all this means I have divided the three thousand data points into five quintiles, from lowest to highest total energy. For each quintile, I have calculated the average, 25th percentile and 75th percentile blood ketone (BHB) value. Half of the ketone values will fit between the 25th and 75th percentile values.

The key takeaway from this analysis is that, as detailed in the chart below, the lowest blood sugar levels are associated with lower ketone levels and a lower total energy.
|
quintile |
average BG (mmol/L) |
BG (mg/dL) |
ketones (mmol/L) |
total energy (mmol/L) |
||
|
25th |
average |
75th |
||||
|
1 |
4.5 |
80 |
0.3 |
0.6 |
0.7 |
5.0 |
|
2 |
4.9 |
88 |
0.4 |
0.8 |
1.1 |
5.7 |
|
3 |
5.1 |
92 |
0.6 |
1.1 |
1.5 |
6.2 |
|
4 |
5.1 |
92 |
1.2 |
1.8 |
2.3 |
6.9 |
|
5 |
5.1 |
92 | 2.2 |
3.2 |
4.0 |
8.3 |
In the discussion above we see that the lowest risk of the modern diseases of ageing and metabolic health occurs when we have a HbA1c of less than 5%. Dr Richard Bernstein recommends a blood glucose of 83 mg/dL or 4.6 mmol/L as optimal. It seems that as a general rule (maybe other than when we are fasting or aiming for therapeutic ketosis) being somewhere to the left of this chart is optimal.
You may not always be able to live at a very low total energy level, but as you fast or increase the spacing between your meals your total energy levels will decrease, and you will get all the positive benefits of fasting. (See How to Use Your Blood Sugar Meter as a Fuel Gauge and How to Use Your Bathroom Scale as a Fuel Gauge for objective measures to refine your balance between feasting and fasting to achieve your goals).
You don’t achieve optimal ketone levels by adding fat with super high ketone levels, but rather by managing your energy balance, carbohydrate intake, and meal timing so you can dip into endogenous ketosis on a regular basis.
When you do eat, you should try to maximise nutrient density to ensure you get the nutrients you need. Your blood ketone levels will decrease when you are using insulin to build and repair your muscles. When you stop eating for a while, you will see them rise again as fat flows out of storage.

Anecdotally it seems that people who are very physically fit may find they have lower blood ketone levels. Lower blood ketone levels (say greater than or equal to 0.2mmol/L) with low blood glucose levels seems to be a healthy place to be.

In fact, you could even save your money on testing ketones and just focus on making sure your blood sugars are closer to optimal. One of the simplest and most accurate blood glucose machines is the Abbott FreeStyle Lite.

If you want to test your ketone levels and blood glucose levels, then the Abbot Optium Neo is the one to go for.

If you don’t have health cover for diabetes, the test strips can get expensive if you want to check regularly. However, you can quickly get a feel for whether you are insulin resistant and which nutritional approach you need to follow.
A smart friend of mine, Robert Miller, has been challenging my thinking recently around ketones. Robert’s theory is that the benefits that people attribute to ketones are actually largely due to an increase in nicotinamide adenine dinucleotide (NAD+).[19] [20]
Adequate levels of NAD are critical to moving energy around our body, from our food to our mitochondria.[21]

NAD+ declines with age, increases in fasting, during a ketogenic diet or in response to exercise. When NAD+ rises, SIRT1 helps our body to repair and improve our insulin resistance.[22]
Our NAD+/NADH balance is critical to controlling our appetite and telling the body whether we need more fuel, or if it’s time to tap into our body fat stores.

We can increase our circulating levels of NAD+ by eating a nutrient dense diet, particularly with adequate niacin (vitamin B3).[23] There are a range of NAD+ supplements that seem to have positive benefits.
Nicotinamide Riboside is a close precursor to NAD+ which can be helpful for people who struggle to make NAD+ directly from food.

However, Nicotinic Acid (i.e. full flush niacin) is a much cheaper supplement that will work just as well for most people.

NAD+ metabolism is a fascinating rabbit hole if you want to do some research, but for now, let’s say that it’s important to have adequate NAD+ to enable your mitochondria to convert the food you eat to energy rather than having it back up in your body.
You will likely be aware that three separate types of ketone bodies:
- acetone (breath ketones),
- acetoacetic acid, and
- beta-hydroxybutyric acid (BHB in the blood).

Fatty acids come to the liver either from our food or lipolysis (mobilisation of fat from our body) and converted to acetoacetate. Unfortunately, we have no way to directly measure acetoacetate, only BHB in the blood and acetone in the breath.

The Ketonix is a device that you blow into that measures the acetone which is akin to exhaust that is released when you burn acetoacetate. [Special thanks to Michel Lundell from Ketonix for sharing the data and Alessandro Ferretti and Weikko Jaross for help with number crunching.]

Blood ketones (BHB) are the most well-known form of ketone bodies. There is some relationship blood ketones and breath ketones, but it is not direct. The chart below is Measuring Breath Acetone for Monitoring Fat Loss: Review (Anderson, 2015)[24] which states
“Endogenous acetone production is a by-product of the fat metabolism process… Breath acetone concentration (BrAc) has been shown to correlate with the rate of fat loss in healthy individuals… A strong correlation exists between increased BrAce and the rate of fat loss.”

The Ketonix data shows a similar relationship but with a lot of scatter!

Most people at this point throw in the towel and go back to blood ketones (BHB) which appear to be more reliable. However, it’s important to note that breath acetone is a stronger marker of burning ketones for fuel, not just buffering energy in the blood.
What I’m trying to illustrate with the dodgy clip art in the chart above is that having high blood ketones and low levels of breath acetone appear to be a sign that you are not burning the fat you’re eating.
By contrast, a high level of breath acetone with a low level of blood ketones (BHB) and low blood glucose may be a sign that you are very efficiently burning the fat you eat.
If you had a choice, I think it’s better to have high breath acetone (BrAce) and lower blood ketones (BHB) (which would indicate that you were efficient at burning fat) than high BHB and low BrAc (which would indicate that you were good at eating fat but not necessarily burning fat).
The figure below shows BHB vs BrAce for the different purposes that people nominate for using the Ketonix. What we see is that people with diabetes (red trend line) have both higher blood glucose and higher blood ketone (BHB) levels (i.e. higher total energy). Fuelling the mitochondria with the right nutrients that increase NAD+ will both help to burn off the excess energy and manage appetite through the NAD+/NADH ratio.

The second law of thermodynamics states that the total entropy (chaos) of an isolated system can only increase over time. The total energy concept is novel, but it seems that an organism that is ageing will decay and not be able it’s energy packed in storage, but rather we will see increasing levels of energy floating around in the bloodstream.

- Metabolic related diseases such as heart disease, cancer, stroke, diabetes, Alzheimer’s disease, kidney disease are the leading causes of death.
- People with the best metabolic health (i.e. low HbA1c, insulin and blood sugar levels) have the lowest risk of dying from these common western diseases of ageing.
- Keeping your processed and starchy carbohydrates low will help to keep your blood glucose and insulin levels and reduce your risk of obesity.
- When we fast, our glucose levels decrease, and ketones increase to maintain our energy levels.
- People who are metabolically healthy and insulin sensitive typically have a lower level of total energy (i.e. glucose + ketones) in their bloodstream.
- We can mimic the rise in ketones with added fats or exogenous ketones that we see in fasting. However, the real benefits occur when the body is forced to draw on its own stored energy, and we experience autophagy, upregulation of SIRT1, and a rise in NAD+.
- The benefits that we often attribute to ketones may also be due to increased NAD+ levels which occur in fasting and/or with a nutrient-dense diet.
- We can only measure beta-hydroxybutyrate (in the blood) and acetone (in the breath). We can think the BHB as a buffer ready for use, and acetone as the exhaust showing that the ketones have been burned for fuel. Higher levels of fat burning with a lower need for buffering is a better place to be than a large buffer in the blood and minimal fat burning.
[2] https://www.researchgate.net/profile/Peter_Petocz/publication/13872119_Holt_SHA_Brand_Miller_JC_Petocz_P_An_insulin_index_of_foods_the_insulin_demand_generated_by_1000-kJ_portions_of_common_foods_Am_J_Clin_Nutr_66_1264-1276/links/00b495189da41714fa000000.pdf/download?version=vs
[4] http://www.cardiab.com/content/12/1/164
[10] http://wholehealthsource.blogspot.com.au/2009/12/whats-ideal-fasting-insulin-level.html
[13] http://emedicine.medscape.com/article/2089224-overview
[15] https://www.facebook.com/AdaptYourLife/videos/vb.1608140252761871/1899686180273942/?type=2&theater
[25] https://nutritionandmetabolism.biomedcentral.com/articles/10.1186/s12986-015-0009-2
[26] http://care.diabetesjournals.org/content/24/2/362
post last updated October 2017

optimising your diet for normal blood sugar and insulin levels:
OnKeto.com is a news aggregation service that brings you best of world articles to you for your consumption.
Author: Marty Kendall
Author URL: https://optimisingnutrition.com/author/martykendall/
Original Article Location: https://optimisingnutrition.com/2015/07/20/the-glucose-ketone-relationship/